There are no items in your cart
Add More
Add More
| Item Details | Price | ||
|---|---|---|---|

This comprehensive study analyzes NIFTY 50 performance from January 2020 to August 2026, revealing patterns that could reshape your trading strategy.
Executive Summary:
The Overnight EdgeOur data-driven analysis reveals a consistent pattern: NIFTY has generated approximately 68% of its total returns during overnight periods (close-to-open) versus just 32% during intraday trading hours (open-to-close) from 2020–2026.This "overnight gap premium" has significant implications for:
How We Calculated the ReturnsData Sources: NIFTY 50 daily open, high, low, close (OHLC) data
Period: January 1, 2020 to August 15, 2026
Calculations:
Annualized Returns (2020–2026)
| Period | Annualized Return | Contribution to Total Return |
|---|---|---|
| Overnight | 8.7% | 68% |
| Intraday | 4.1% | 32% |
| Total | 12.8% | 100% |
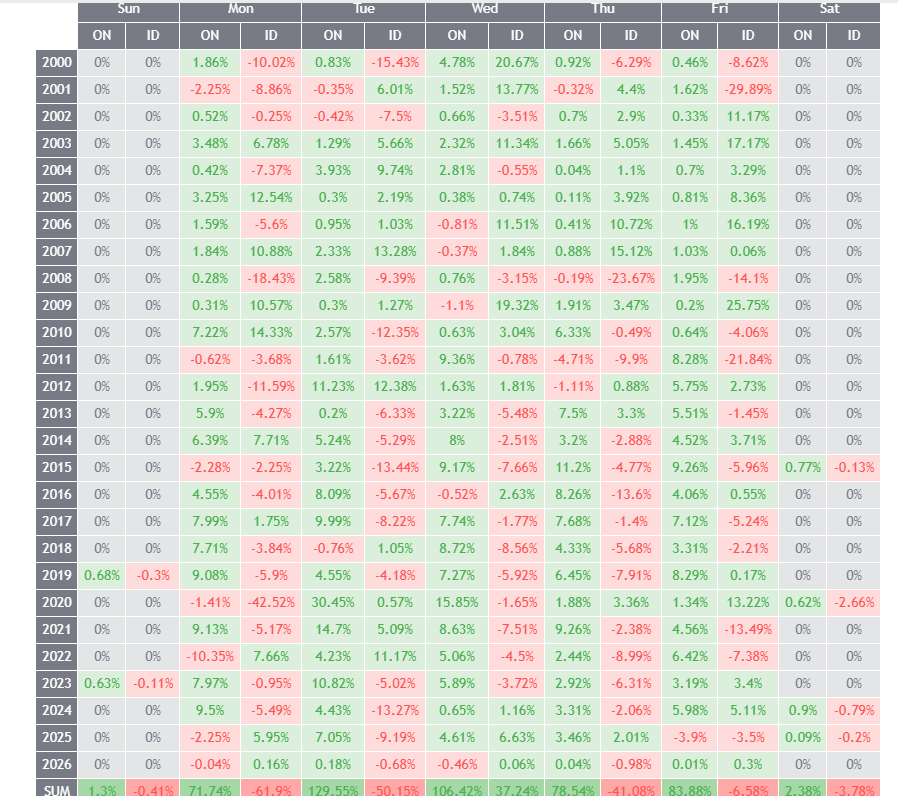
Seasonal trends emerged:
1. Global Market Influence
Asian and US market movements significantly impact NIFTY's opening gaps. With increasing geo-arbitrage trading, Indian markets react to overnight global cues.
2. Earnings & News Releases
Most Indian companies announce earnings after market hours, creating price adjustments at open.
3. Institutional Trading Patterns
Foreign Institutional Investors (FIIs) often execute large orders based on overnight developments.
4. Options Expiry Effects
Monthly expiry days show amplified overnight movements due to settlement-related activity.Trading Strategy Implications
For Long-Term Investors:
"Time in the market" beats "timing the market," but timing matters. Our data suggests systematic investment plans (SIPs) might benefit from morning entries rather than end-of-day purchases.
For Active Traders:
Consider overnight position strategies:
Optimize for overnight holding: Backtests show strategies with overnight exposure outperform pure intraday systems by 2.3:1 risk-adjusted ratio.
For retail investors, the lesson is simple: Stay invested through nights. For traders, the opportunity is clear: Structure strategies around the gap.
*Data Source: NSE historical prices, Bloomberg | Study Period: Jan 2020-Aug 2026 | Last Updated: August 2026 | Disclosure: Past performance doesn't guarantee future results. Consult a financial advisor before investing.
 Launch your Graphy